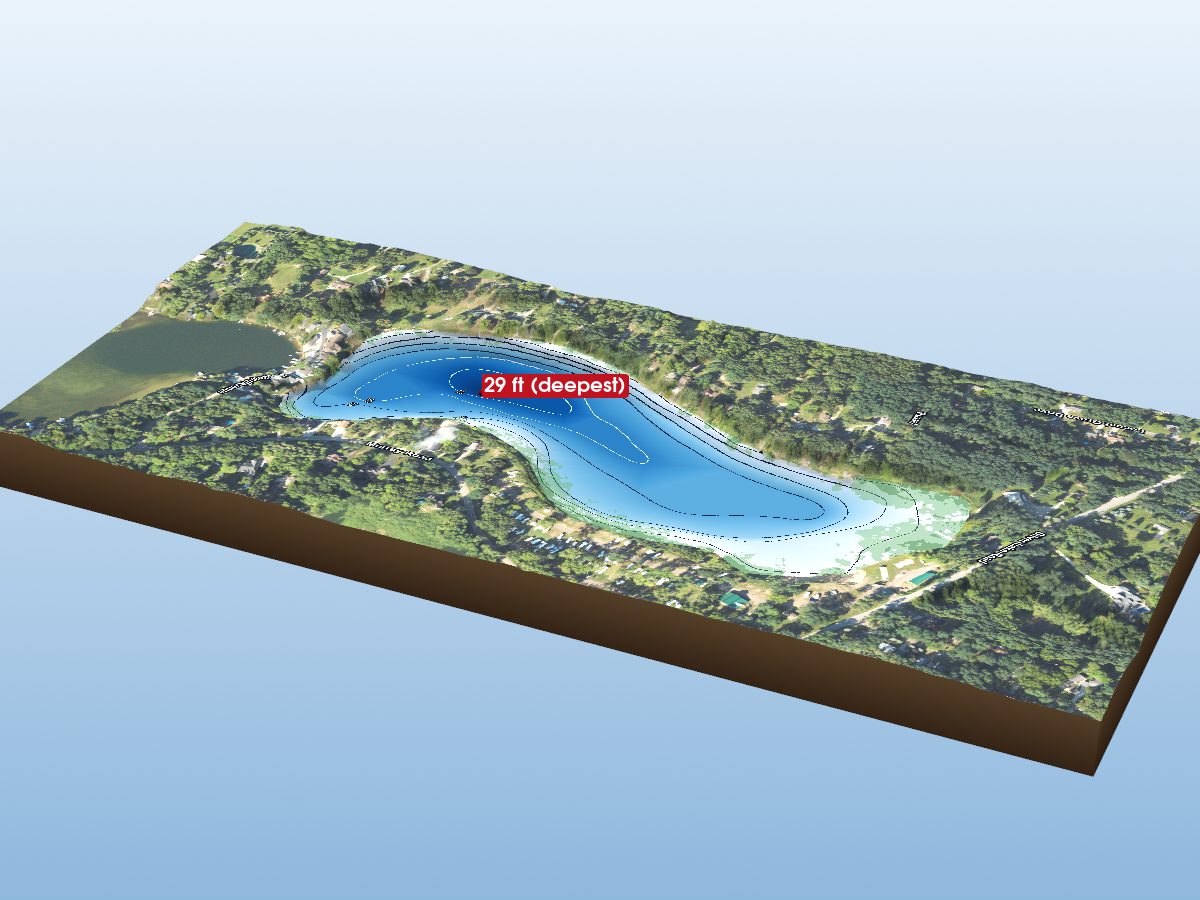
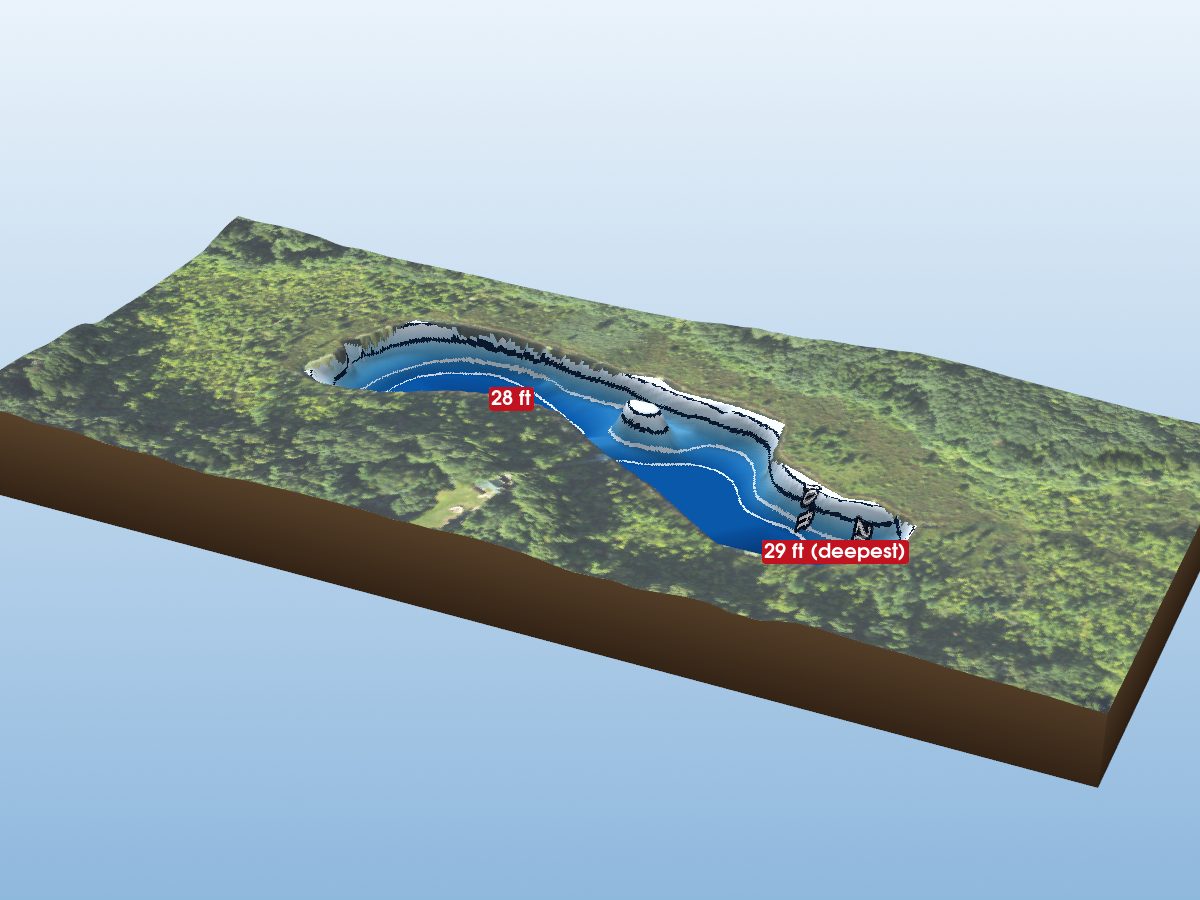
Shinanguag Lake
depth
Get directions
Depth scale
Survey readout
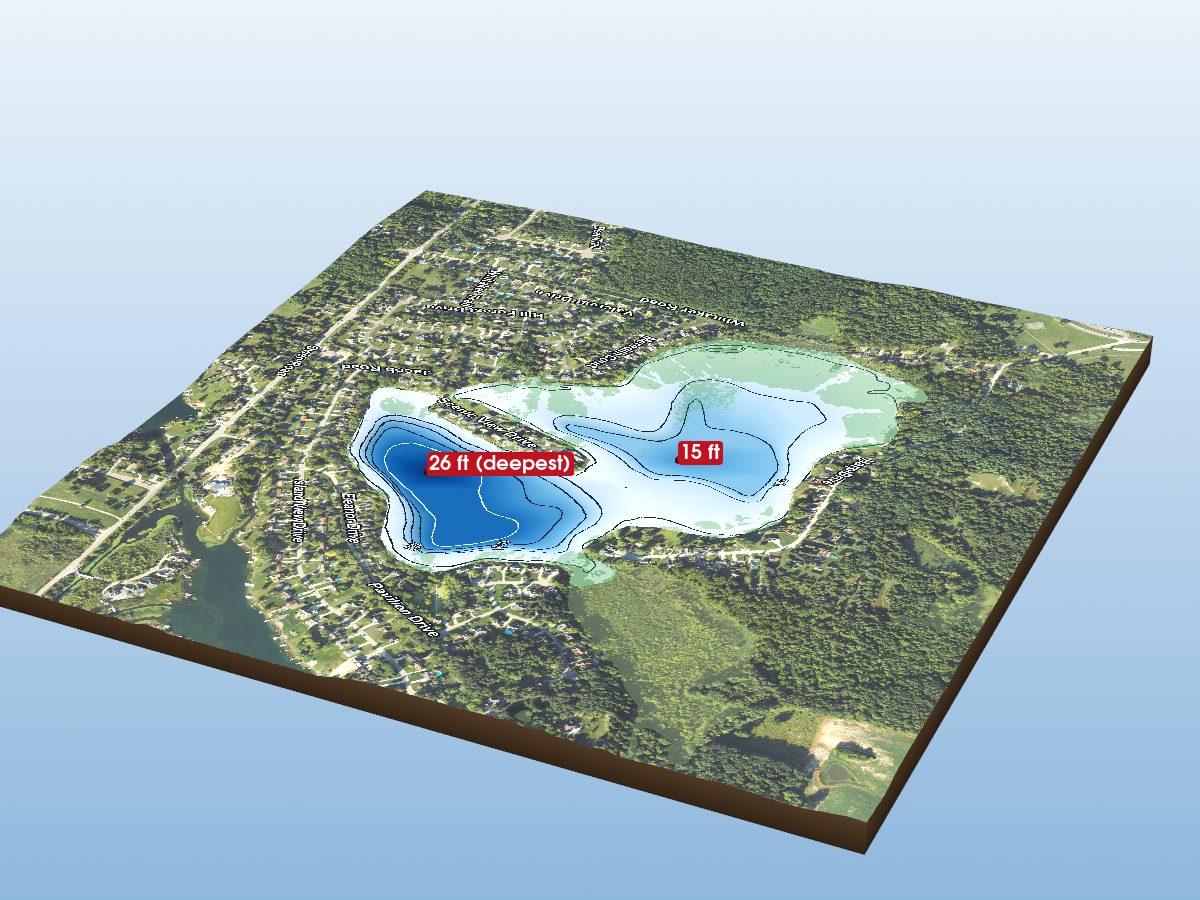
Shinanguag Lake is mapped to a depth of 35 ft on the Michigan DNR survey and covers about 226 acres in Genesee County, Michigan.
Measured from the Michigan DNR inland-lake contour survey (depths read from the survey's isobath field; this lake's summary-depth column is blank in the source).
- Deepest sounding
- 35 ft
- Mean depth
- 5.9 ft · estimated
- Surface area
- 226 acres
- Estimated volume
- 1,340 acre-ft · 437M gal
- Shoreline
- 4.56 mi · irregular
- Aquatic vegetation
- 4% of surface · NDVI estimate
- Trophic state
- Mesotrophic · satellite estimate · details
- Public access
- No public DNR launch identified
Additional depth details6 contours
- Contour depths
- 0–35 ft
- Recorded point soundings
- 35 ft, 30 ft, 25 ft, 25 ft
91.4% of the surface sits over water shallower than 10 ft; 4.3% is deeper than 20 ft. Depth, area and volume are estimated from the interpolated survey surface — historical reference, not measurement.
Compare with another lakeProvenance
Sources: MI DNR inland lake contours, USGS 3DEP, USDA NAIP (public domain), OpenStreetMap (ODbL), MI DNR Boat Launches.
⚠ Not for navigationSpot an error? Send a correction
Map details & sources5 sources
All layers registered to one bounding box; positions in WGS 84.
Survey-derived depth contours drape over USGS 3DEP elevation, with a USDA NAIP aerial basemap and OpenStreetMap shoreline. Color shows surveyed depth; dark lines are the survey's own isobaths.
- Coordinates
- 42.89441, -83.49992
- MI DNR lake ID
- L12551
- Vertical exaggeration
- 2.49×
- Basemap
- USDA NAIP · public domain
- Model size
- 2.4 MB
Lake productivity & trophic state
Satellite estimateSatellite-estimated classification: Mesotrophic. Moderate nutrient levels and biological productivity. Based on satellite estimates of summer chlorophyll-a (LAGOS-US LANDSAT, 2020). No lake-specific measurement is available in this dataset.
Trophic state describes how biologically productive a lake is, based on indicators such as nutrients, algae and water clarity. It is not a swimming-safety or overall water-quality rating.
What do the categories mean?
- Oligotrophic≤ 2 µg/L · lower nutrient and algae levels, often clearer water and lower biological productivity.
- Mesotrophic · this lake2–7 µg/L · moderate nutrient levels and biological productivity.
- Eutrophic7–30 µg/L · higher nutrient levels and biological productivity, often with more algae or aquatic plant growth.
- Hypereutrophic> 30 µg/L · very high nutrient levels and biological productivity, with a greater potential for heavy algae growth and low water clarity.
Bands are summer (June–August) mean chlorophyll-a, the green pigment in algae, at the EPA 2012 National Lakes Assessment thresholds. Trophic condition can change over time and by measurement method. Source: Midwest Glacial Lakes Partnership Conservation Planner; satellite chlorophyll-a estimates from LAGOS-US LANDSAT.
Paddling
Paddling Index methodology v1.0 · calculated 2026-09-23Shinanguag Lake has a mixed natural and developed setting, generally sheltered geometry, substantial nearby higher-volume roads. No special watercraft restriction is identified in the current source.
Why this score?5 components
Included in the index
| Component | Rating | Points of weight | Measurement |
|---|---|---|---|
| Natural setting | Mixed | 9.9 of 35 | 44% natural land cover within 150 m of shore (27% forest, 15% wetland; 35% developed) |
| Geometric wind exposure | Very Good | 18.3 of 29 | mean fetch 1,008 m · 3% of sampled water within 500 m of shelter · generally short fetch |
| Watercraft controls | None identified | 8.8 of 18 | No special watercraft restriction identified in the current DNR source. Motors permitted, subject to general law. |
| Public access | Not listed | — | No DNR-listed access site. Township, county and road-end launches are not in this source, so this is not evidence that access is poor — the component is excluded and the remaining weights are renormalized. |
| Road isolation | Modest | 2.6 of 18 | substantial nearby higher-volume roads · 49 MDOT-classified segments within 1.2 km, peak 15,484 vehicles/day |
Additional paddling considerations
These describe the lake but are not part of the v1 Paddling Index and do not change the number above.
- Wake sensitivity
- Low — wide enough that wakes disperse over most of the lake
- Aquatic vegetation
- Low — approximately 4% mapped coverage · NAIP aerial imagery (NDVI)
- Observed motorized activity
- Unknown — No lake-level measurement of boat traffic is available. Legal permission to operate motors is not evidence of use.
- Wildlife habitat potential
- Limited — 27% forest and 15% wetland cover within 150 m of shore
Compare Michigan lakes by Paddling Index →
Non-native species records
1 recordPlants & algae

How to identify invasive species in Michigan lakes →
What does non-native mean?
USGS records identify non-native species that have been documented for this lake or its shoreline. Non-native does not necessarily mean invasive, and historical records do not confirm current presence.
Source: Midwest Glacial Lakes Partnership Conservation Planner; underlying nonindigenous species records from the USGS Nonindigenous Aquatic Species database.
Bait & tackle nearby
licensed retail bait dealers · straight-line distanceShinanguag Lake — common questions
How deep is Shinanguag Lake?
The deepest contour on the Michigan DNR bathymetric survey of Shinanguag Lake is 35 ft. That is the deepest depth the historical survey map records, which may differ from the deepest point of the lake itself.
How big is Shinanguag Lake?
Shinanguag Lake covers about 226 acres in Genesee County, Michigan.
What is the average depth of Shinanguag Lake?
The estimated mean depth of Shinanguag Lake is 5.9 ft, calculated from the survey contours.
Is there public access to Shinanguag Lake?
No public launch for Shinanguag Lake appears in the Michigan DNR access data. That is not the same as the lake being private -- municipal and private ramps are not in that source.